Freezing Rain
Summary
- Freezing rain events have important and dangerous impacts on nearly all sectors region-wide.
- The frequency of these events varies depending on the location.
- In the more southern, warmer parts of the Great Lakes region, freezing rain events are declining.
- As the region warms and the rain-snow line moves, on average, northward, freezing rain events should be expected in regions that have in the past been reliably snowy.
- The warming climate means that storms often contain more moisture; therefore, record-breaking accumulations are likely.
What is Freezing Rain, and How Does it Form?
Freezing rain occurs when frozen precipitation falls through a warm layer of air, causing the precipitation to melt and change from solid to liquid. However, because the surface where it lands is below freezing, the liquid precipitation freezes on contact, creating a dangerous icy layer. Typically, the severity of freezing rain events is related to the duration of the event.
Freezing rain events can be caused by multiple atmospheric patterns that have specific sets of conditions:
- Low-lying valleys typically contain cold air, and when warm, moist air flows over the cold air, freezing rain events often occur.
- Frontal occlusion, or when a cold front overtakes a warm front, can trap cold air near the Appalachian Mountains.
- Easterly flow from the Atlantic Ocean holds cold air masses against the Appalachian mountains while warm, moist air masses flow over it. This is also called cold air damming.

An infographic describing how different types of precipitation form. Figure provided by the Northwest Indiana Weather Forecasting Office of the National Weather Service.
Importance of Freezing Rain Events
Because freezing rain creates an often invisible layer of ice on roadways, sidewalks, and runways, these events make travel dangerous. The weight of the accumulated ice can lead to downed trees and power lines, causing communities to lose power for extended periods of time. These events are rare in occurrence and have the potential to cause billions of dollars in damage and create great risks to communities and human life. 1 2 3 4 5
For residents and drivers, a practical freezing rain driving checklist can help translate freezing-rain impacts into pre-trip decisions, vehicle preparation steps, and situations where delaying travel is the safer choice.
The 2025 Northern Michigan Ice Storm was a large event affecting many communities. The event was the result of several rounds of precipitation on March 28-30, 2025. The colder conditions within the area caused the passing rain to turn into freezing rain as temperatures hovered around 32°F. Severe icing occurred on the Mackinac Bridge, and several communities experienced power loss, reduced communication services, downed trees, and the lack of running water. A more detailed summary of the 2025 Northern Michigan Ice Storm is available from the NWS Gaylord, MI weather forecasting office (WFO).
Observed Changes in Freezing Rain Patterns
As the climate warms, winters in the Great Lakes region are warming faster than other seasons. We already observe a decrease in snow in the southern part of the Great Lakes Basin, as precipitation that would have, historically, been snow is falling as rain. The rain-snow boundary is migrating north. Because freezing rain occurs at temperatures near freezing, it is plausible to expect freezing rain events to be more likely in regions that previously experienced snow. Other changes in the location of winter storms would also have an effect on freezing rain events.
The top figure from Delpizzo et al. (2025) shows the annual average number of hours of freezing rain in the region. The largest values are in the eastern part, where there is more orography and greater amounts of moisture because many winter storms transport water from the Atlantic. Unlike snowfall, there is no obvious lake-effect for freezing rain.
Changes in freezing rain as the climate warms are not easily described. Events are uncommon, and we are searching for changes in events that are, by their nature, difficult to analyze. Analysis of the observations shows freezing rain events are becoming more common but shorter-lived.6 This is consistent with regional warming. Geographically, there has been an increase in freezing rain along an east-west line just north of Lake Huron. In the more southern part of the region, 42°N – 46°N, e.g., southern Michigan and Wisconsin, trends vary from west to east. West of Lake Michigan has seen a decrease, and east of Lake Michigan an increase. We note an exception to this in Rochester, Minnesota, that shows an increase and has strong orographic forcing.7
There have generally been decreases in the Appalachian Mountains.
Because of the large influence of orography and lakes, the changes in freezing rain are not spatially homogeneous. Because of this spatial variability, planners need to be aware of local conditions that may not be consistent with overall trends in the region.
The bottom figure shows the changes in freezing rain by month. There have been increases in January, likely because snow events have been replaced by freezing rain events as the region has warmed. The largest statistical changes, however, are in March and April. March shows a decrease, and April shows an increase.8 Further analysis would be required to describe the changes in March and April more completely.
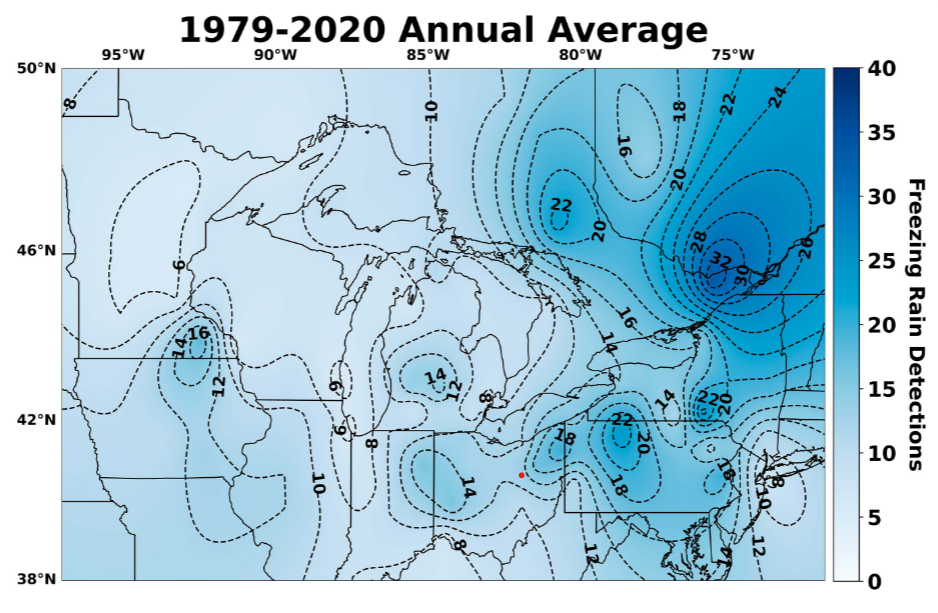
The mean annual hours of freezing rain events reported during October through May 1979-2020 based on station observations. Source: Delpizzo et al., 2025.
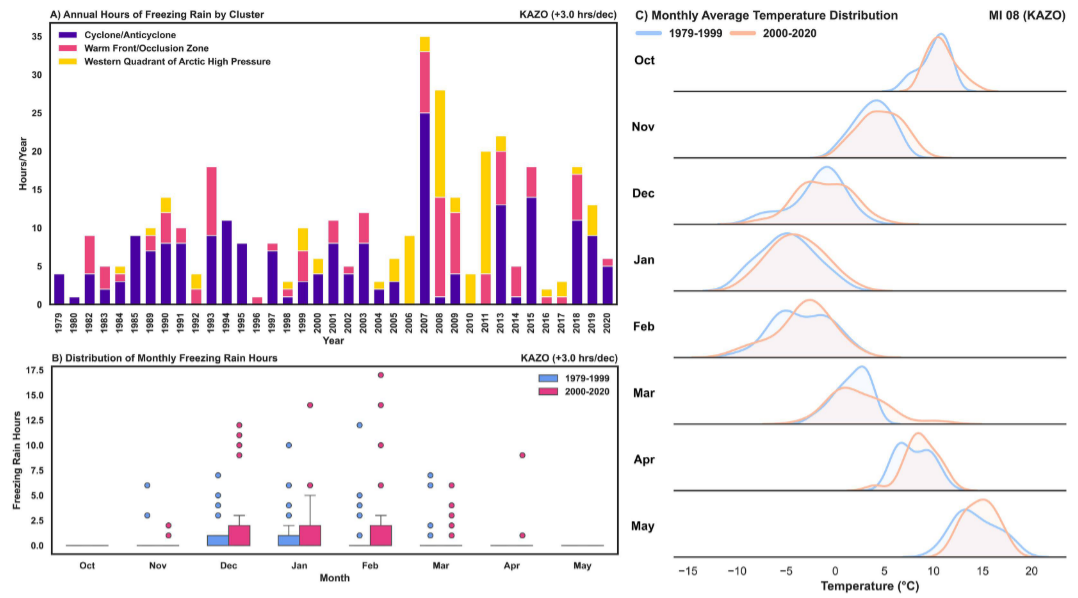
The freezing rain events by a) hours of events observed per year, b) boxplots of monthly event totals for 1979-1999 (blue) and 2000-2020 (pink), and c) monthly temperature distributions from the MI Climate Division 8 (Southwest Lower Michigan) for Kalamazoo, MI (KAZO) based on observations. Source: Delpizzo et al., 2025.
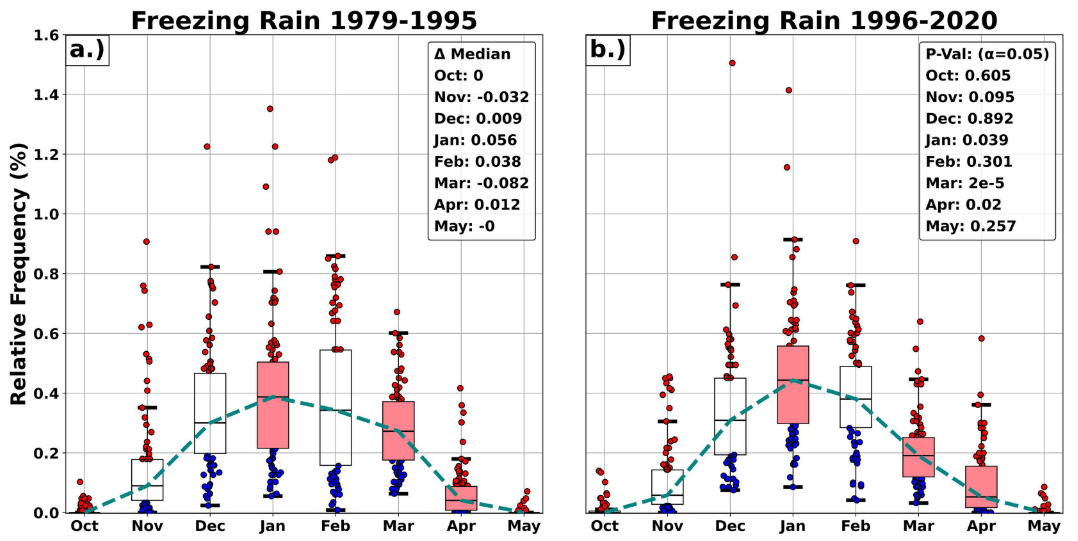
The monthly distribution of freezing rain events (a) from 1979 to 1995 and (b) from 1996 to 2020. Teal dashed lines represent median values, boxes signify the interquartile range (IQR) of 25%-75% percentiles, whiskers indicate 5th and 95th percentiles, and dots represent the outliers. Shaded red boxes indicate a statistically significant change in a given month between the two periods. The legend in (a) shows the change in monthly median freezing rain events, and the legend in (b) shows the Mann-Whitney test p-value at the 95% confidence level. Source: Delpizzo et al., 2025.
Projected Changes in Freezing Rain Patterns
In summary, due to the complex microphysical processes and local small-scale dynamics, freezing rain is beyond our ability to directly predict. We can place future changes into the context of regional warming. Because of the importance of being close to the freezing line, we expect, on average, decreases in the southern part of the region. In the coming decades, we expect increases in the more northern parts of the region as snow regions become more ice regions.
The previously observed trends should motivate practitioners to consider and plan for increased impacts of freezing rain events in the future. Under projected climate conditions for the Great Lakes region, a future scenario considering freezing rain events that may be likely is a general decrease in the frequency of freezing rain events, with a further concentration of freezing rain events during the winter months. A warming cold-season climate does not mean that freezing rain will not occur in the future, but it may be concentrated in events that are strong and more associated with local conditions as opposed to large-scale weather systems.
References
- Bernstein, B. C., 2000: Regional and local influences on freezing drizzle, freezing rain, and ice pellet events. Weather and forecasting,15 (5), 485–508
- Changnon, S. A., and K. E. Kunkel, 2006: Severe storms in the midwest. ISWS Informational/Educational Materials 2006-06.
- Davis, N., A. N. Hahmann, N.-E. Clausen, and M.ˇZagar, 2014: Forecast of icing events at a wind farm in sweden. Journal of Applied Meteorology and Climatology,53 (2), 262–281
- Lott, N., and T. Ross, 2006: Tracking and evaluating us billion dollar weather disasters, 1980-2005. Asheville, NC: NOAA National Climatic Data Center
- Murphy, C., and Coauthors, 2020: Adapting existing energy planning,simulation, and operational models for resilience analysis. Tech.rep., National Renewable Energy Lab.(NREL), Golden, CO (UnitedStates).
- DelPizzo, J., Baule, W. J., Tobias-Tarsh, L., Notaro, M., & Rood, R. B. (2025). Climatology and recent changes in the occurrence of freezing rain throughout the Laurentian Great Lakes Region. Journal of Applied Meteorology and Climatology, 64(10), 1395–1409. https://doi.org/10.1175/jamc-d-24-0204.1
- DelPizzo, J., Baule, W. J., Tobias-Tarsh, L., Notaro, M., & Rood, R. B. (2025). Climatology and recent changes in the occurrence of freezing rain throughout the Laurentian Great Lakes Region. Journal of Applied Meteorology and Climatology, 64(10), 1395–1409. https://doi.org/10.1175/jamc-d-24-0204.1
- DelPizzo, J., Baule, W. J., Tobias-Tarsh, L., Notaro, M., & Rood, R. B. (2025). Climatology and recent changes in the occurrence of freezing rain throughout the Laurentian Great Lakes Region. Journal of Applied Meteorology and Climatology, 64(10), 1395–1409. https://doi.org/10.1175/jamc-d-24-0204.1