LAKE ONTARIO CLIMATOLOGY
Sustained Assessment of the Great Lakes
Resources in this Assessment:
Lake Ontario Overview
Located along the U.S. Canadian border, Lake Ontario is the most eastern of the five Great Lakes, connecting to Lake Erie through the Niagara river. Lake Ontario is the smallest of all the Great Lakes by surface area, though not by volume. The water levels in Lake Ontario are regulated through international agreements.

| Surface Area | Volume | Average Depth | Max Depth | Shoreline |
|---|---|---|---|---|
| 19,009 sq. km | 1,639 cu. km | 86 m | 244 m | 1,146 km |
| (7,340 sq. mi) | (393 cu. mi) | (283 ft) | (802 ft) | (712 mi) |

Lake Ontario basin annotated with major inflows and outflows.
Lake Levels
Variability of water levels in Lake Ontario is observed on many different time spans, including seasonal, monthly, annual, and decadal (Figure 1). Water levels in Lake Ontario are regulated through international agreements. These regulations lead to less variability in water levels of Lake Ontario than the other lakes.
Recent years have seen some of the most rapid fluctuations in the recorded history of Great Lakes water levels. Lake Ontario had a slight decline in water levels beginning in 1998, but did not remain below average in the decade that followed, as the upper Great Lakes did. During this time, the lakes were characterized by an approximately 17 year span of warmer temperatures, low ice coverage, increased evaporation rates, and decreased runoff. An increase in water levels on the upper Great Lakes began in 2014, a year that coincided with a cold air outbreak, low temperatures, extensive ice cover, and high precipitation rates. These conditions continued through the end of the decade to reach record highs on Lake Ontario in 2017 and 2019.

Figure 1: Water levels on Lake Ontario from 1918 to 2020 (blue), with the long-term average water level (red).
Lake levels oscillate on annual cycles and multi-year periods of high and lows (Figure 2). The periods of sustained highs and lows are variable in length. The Great Lakes, including Lake Ontario, have recently experienced a period of rising water levels, which follows a more than ten-year span of low levels on the upper Great Lakes. The past decade was the wettest on record and this record precipitation is the primary contributor to the recent rise in lake levels.

Figure 2: Monthly (blue) and annual (pink) average lake levels for Lake Ontario with annotations denoting annual cycles, highs, lows, and the recent rise.
Lake Ontario water levels over the past several decades have behaved differently than the upper Great Lakes. This is predominantly because Lake Ontario outflow is regulated by the Moses Saunders Dam. This regulation decreases the variability of Lake Ontario water levels. This is demonstrated in the figure below, which compares the high variability of water levels on Lake Michigan-Huron, as denoted by the colored annotations, to the relatively low variability of Lake Ontario water levels. Prior to the completion of the Moses Saunders Dam in 1958 (noted by a black line in the graph), natural water levels on Lake Ontario were more variable, exhibiting similar highs and lows as the upper Great Lakes. Though such regulation significantly reduces the variability of high and low water levels on Lake Ontario, it cannot prevent naturally driven extremes, as seen in recent years (denoted in green on the graph). These recent high water surges were mainly driven by extremely high springtime precipitation and snowmelt runoff combined with high inflows from the upper Great Lakes during the wettest decade on record (2010s). During this period of excessive water in the lake system, outflow regulation could not prevent Ontario levels from reaching record monthly highs.
There is also an additional man-made inflow to Lake Ontario. The Welland Canal was originally constructed in 1829 and today is a series of locks that allows for ships to travel between Lake Ontario and Lake Erie, which are naturally separated by a 230ft drop at Niagara Falls. This created an additional flow from Lake Erie to Lake Ontario, but is not a diversion of water into or out of the Great Lakes basin.

Annotated monthly Great Lakes water levels for Lake Michigan-Huron (top) and Lake Ontario (bottom). Altered image originally from the U.S. Army Corps of Engineers.
The variability of Lake Ontario water levels is also observed on a decadal time scale (Figure 3). The current decade (2010s) of higher water levels occurred after a period of low lake levels (2000s).

Figure 3: Decadal averaged water levels in Lake Ontario (colored horizontal lines) with annual time series (black).
Water levels fluctuate on an annual cycle, rising in the spring and summer due primarily to snowmelt runoff and low evaporation rates, and declining in the fall due to high evaporation rates from the temperature difference between the air (cold) and water (still warm from summer months). On average, the highest lake levels are observed between May and July (Figure 4).
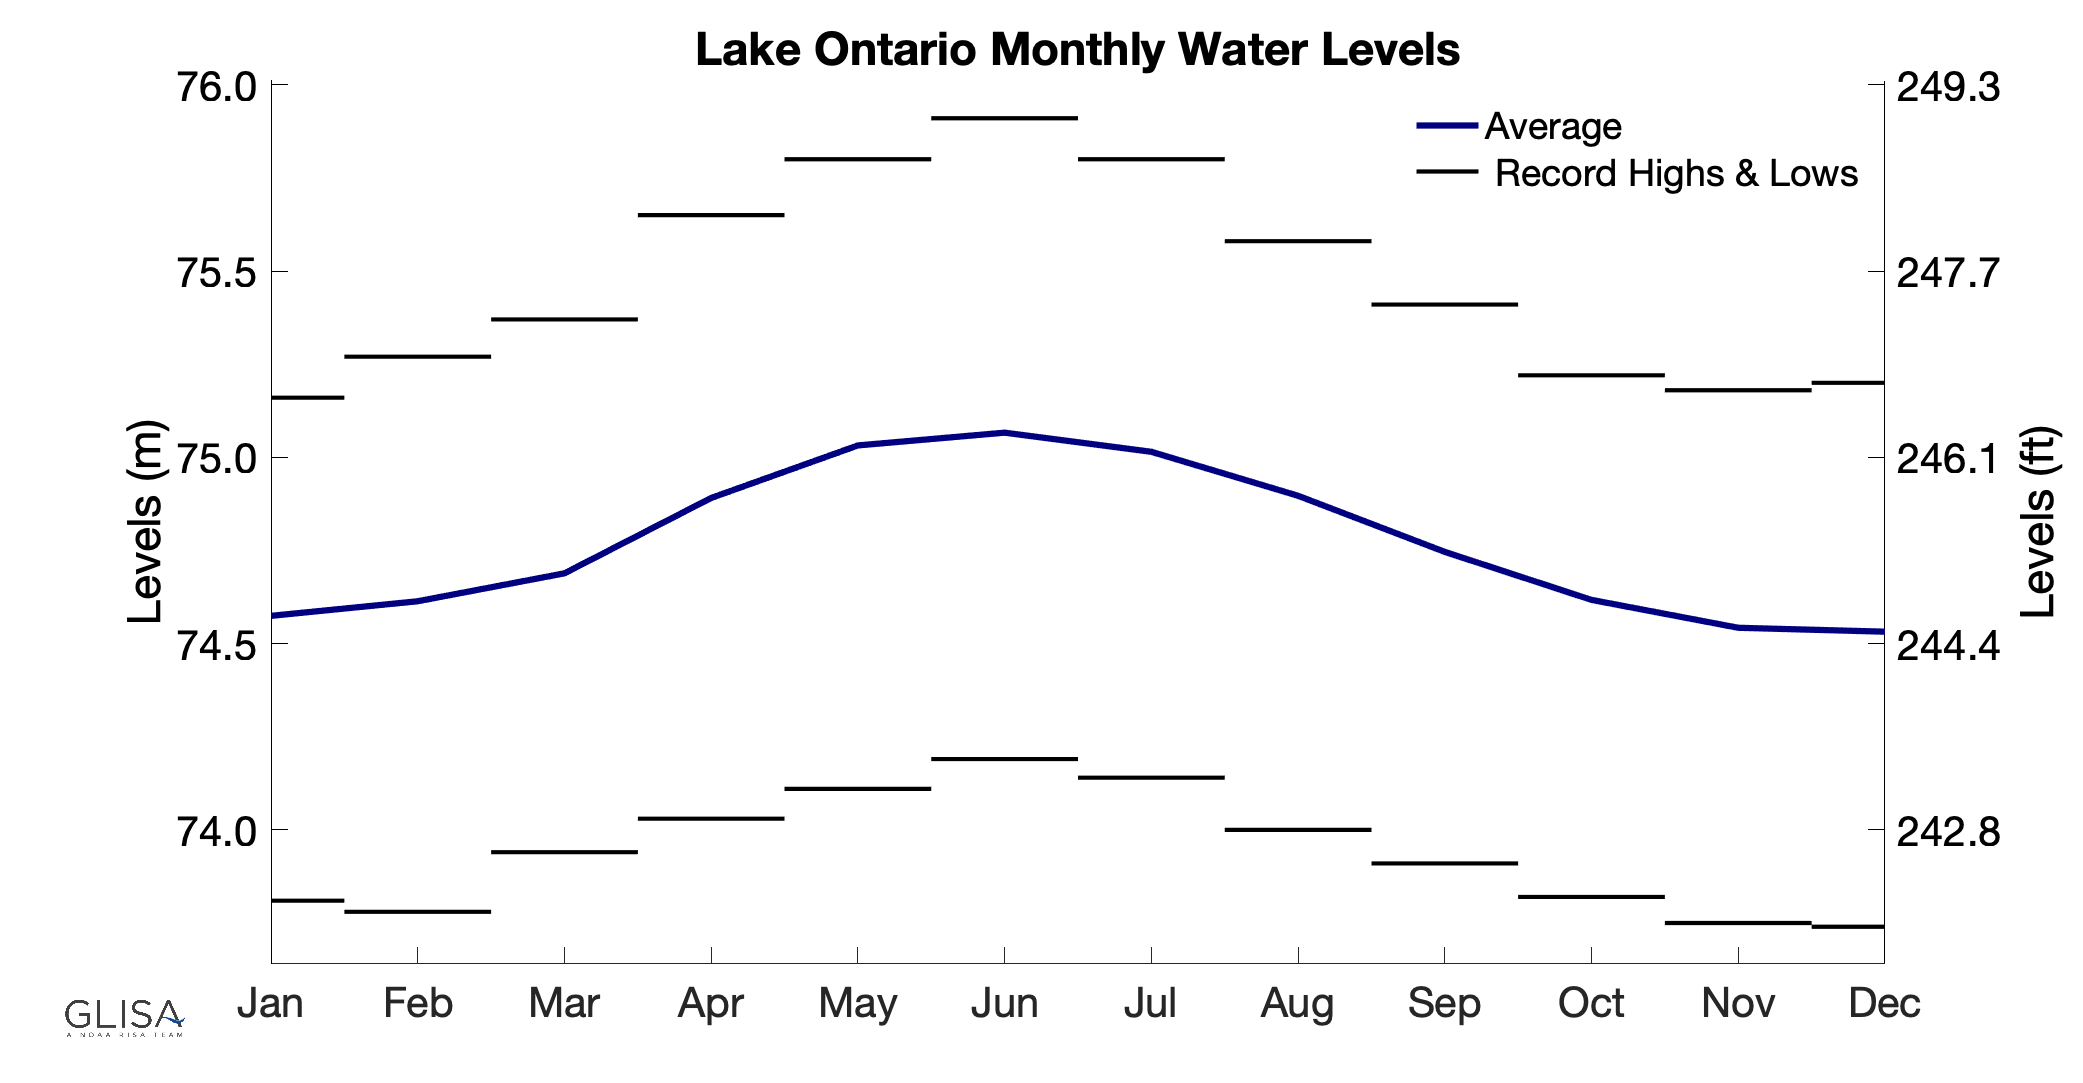
Figure 4: Monthly average water levels from 1918 and 2020 for Lake Ontario (blue line) with the record highs and lows (black lines).
The record lows on Lake Ontario were set in the mid 1930s (Table 1). The record highs on Lake Ontario were previously set in the late 1940s and early 1950s, until 1973, when the water level record was broken for the month of April, and 2017 and 2019 when the record was broken for May through July.
| Jan | Feb | Mar | Apr | May | Jun | Jul | Aug | Sep | Oct | Nov | Dec | |
|---|---|---|---|---|---|---|---|---|---|---|---|---|
| Avg | 74.57m (244.65ft) | 74.61m (244.78ft) | 74.69m (245.05ft) | 74.89m (245.70ft) | 75.03m (246.16ft) | 75.06m (246.26ft) | 75.01m (246.10ft) | 74.90m (245.73ft) | 74.75m (245.24ft) | 74.62m (244.82ft) | 74.54m (244.55ft) | 74.53m (244.52ft) |
| Max | 75.16m (246.59ft) [1946] | 75.25m (246.95ft) [1952] | 75.37m (247.28ft) [1952] | 75.65m (248.20ft) [1973] | 75.80m (248.69ft) [2017] | 75.91m (249.05ft) [2019] | 75.80m (248.69ft) [2019] | 75.58m (247.97ft) [1947] | 75.41m (247.41ft) [1947] | 75.22m (246.78ft) [1945] | 75.18m (246.65ft) [1945] | 75.20m (246.72ft) [1945] |
| Min | 73.81m (242.16ft) [1935] | 73.78m (242.06ft) [1936] | 73.94m (242.59ft) [1935] | 74.03m (242.88ft) [1935] | 74.11m (243.14ft) [1935] | 74.19m (243.41ft) [1935] | 74.14m (243.24ft) [1934] | 74.00m (242.78ft) [1934] | 73.91m (242.49ft) [1934] | 73.82m (242.19ft) [1934] | 73.75m (241.96ft) [1934] | 73.74m (241.93ft) [1934] |
Table 1: Mean, maximum, and minimum water levels in Lake Ontario (Source: Army Corps of Engineers)
Net Basin Supply:
Water levels for an individual lake are driven by the net basin supply (NBS), which depends on the sum of over-lake precipitation and basin-runoff minus over-lake evaporation, as well as how much water flows from one lake to the next. Human-caused diversions, into and out of the lake, are also part of the NBS, but are much smaller than precipitation, runoff, and evaporation (see Lake Levels Overview page for more information).
Over-lake precipitation varies seasonally, with higher totals occurring in the late spring, summer, and early fall months (Figure 5). This seasonality aligns with the seasonal variability of lake levels, with the highest levels occurring at the same time as the greatest total precipitation. Precipitation totals vary annually as well as seasonally, and do not always follow the same pattern year to year.

Figure 5: Monthly averaged over-lake precipitation for Lake Ontario from 1940 to 2019
Runoff rates follow the same general monthly pattern, but can vary in magnitude from year to year (Figure 6). Peak runoff occurs in late spring and early summer, primarily due to snowpack melt. Runoff amounts are also influenced by impervious surfaces such as concrete, that prevent water from entering the soil below, and agricultural practices within the basin.

Figure 6: Monthly averaged runoff for Lake Ontario from 1918 to 2019
Evaporation rates follow the same general monthly pattern from year to year. Maximum evaporation occurs in the late fall and winter months with minimum evaporation occurring in the late spring and early summer months (Figure 7). Because water has a higher heat capacity than air, the lake stays warmer in the fall as air temperature falls. This leads to increased evaporation due to the greater difference in temperature between the air and water. Evaporation is also closely related to high and low ice years. When evaporation rates are high in the fall, signifying more heat loss, it creates conditions for a year with high ice cover. Cold lake surface temperatures and high ice cover then reduce evaporation. The same is true for lower evaporation rates in the fall, signifying less heat loss, and low ice cover years. These conditions can then lead to increased evaporation in the following months (see Ice Cover Overview page for more information).

Figure 7: Monthly averaged over-lake evaporation for Lake Ontario from 1950 to 2019
Precipitation, evaporation, and runoff are combined in total net basin supply for Lake Ontario (Figure 8).

Figure 8: Monthly averaged Net Basin Supply for Lake Ontario from 1950 to 2015
The variability of over-lake precipitation, evaporation, runoff, and total net basin supply can also be observed on a decadal time scale (Figures 9, 10, and 11). The most recent decade (2010s) had the most precipitation on record, which contributed to the increase in water levels that was seen throughout the Great Lakes, including Lake Ontario. High runoff totals were also observed, primarily due to the high precipitation totals that have been recorded in the 2010s. NBS is the combination of precipitation, runoff, and evaporation, modeled by the equation: NBS = P + R – E (Figure 12).

Figure 9: Annual Lake Ontario over-lake precipitation totals (black line) with decadal averaged over-lake precipitation totals (colored horizontal lines).

Figure 10: Annual Lake Ontario runoff (black line) with decadal averaged runoff (colored horizontal lines).
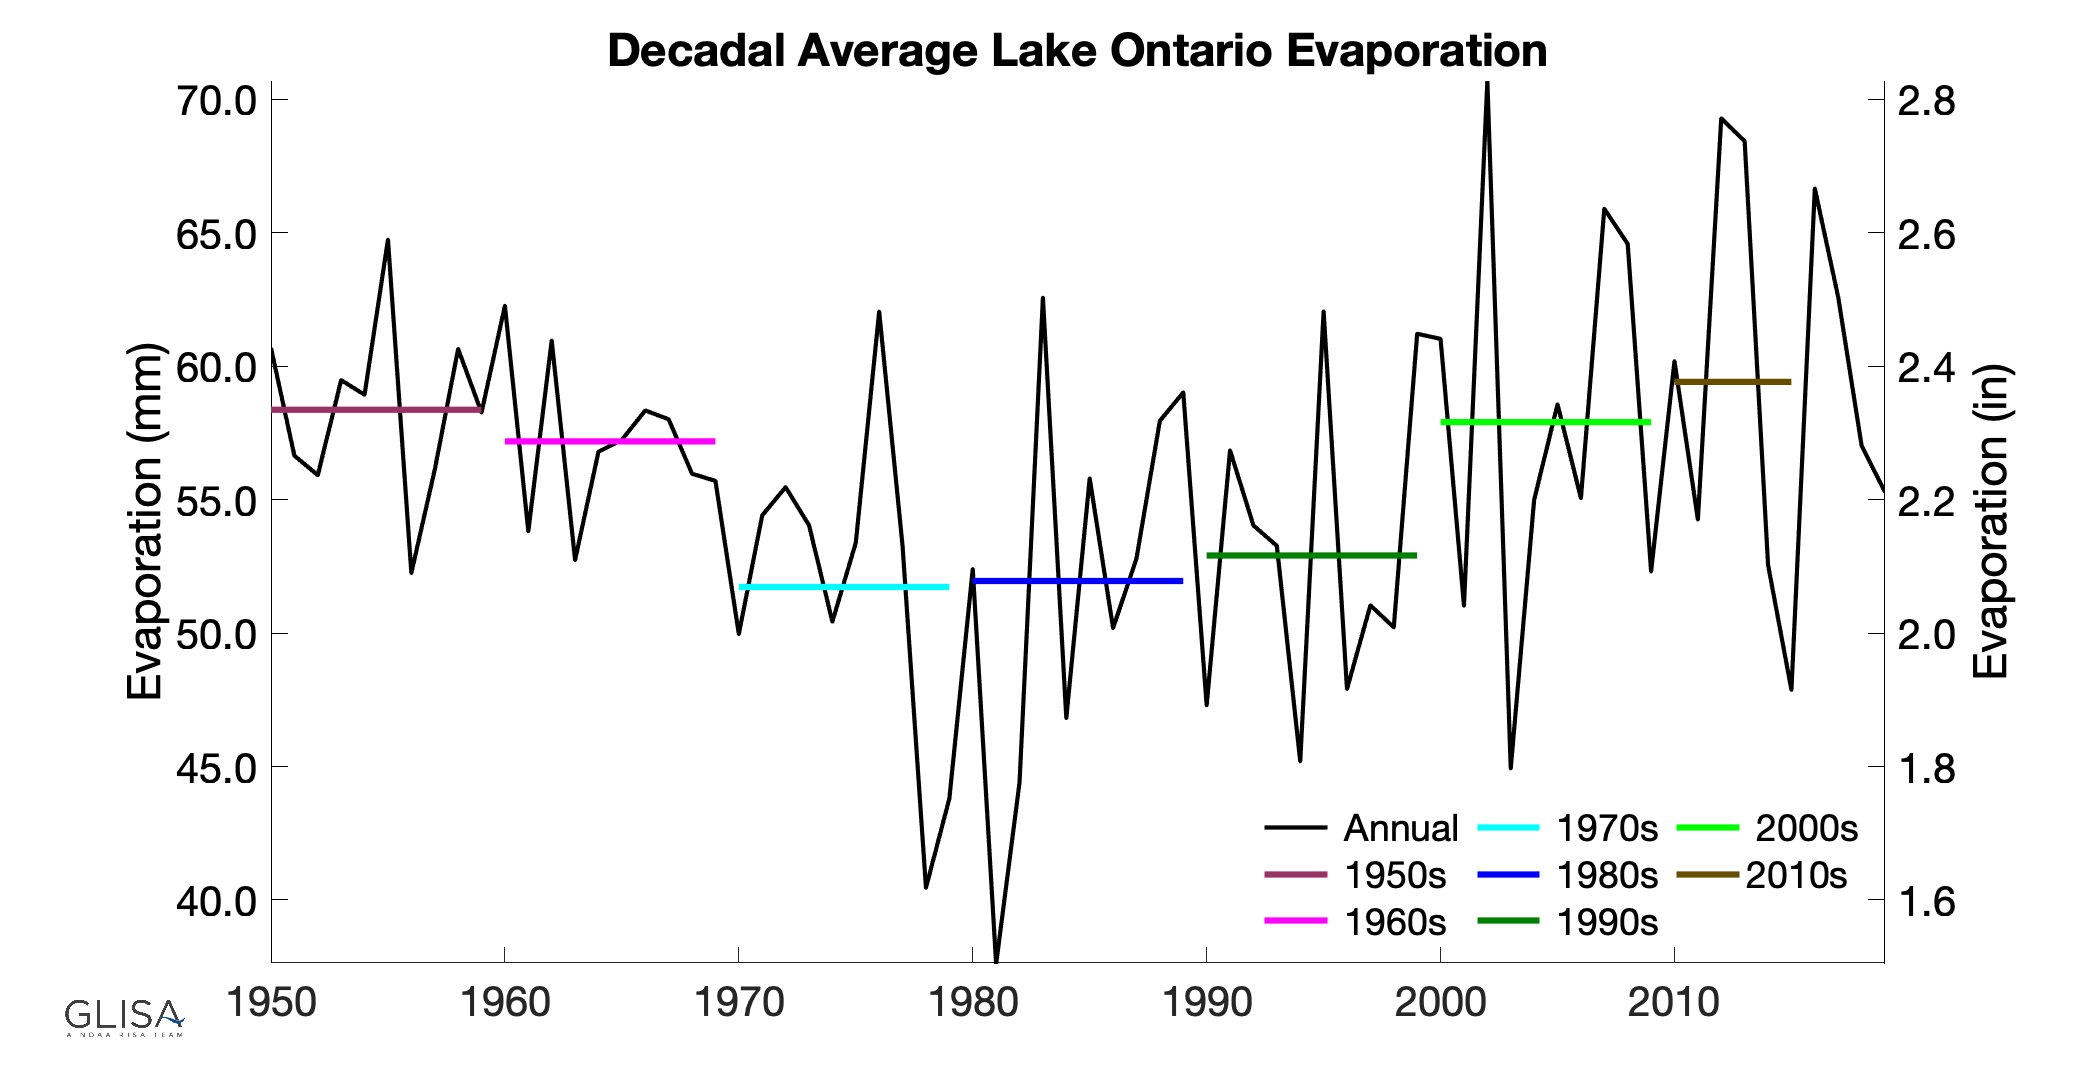
Figure 11: Annual Lake Ontario over-lake evaporation (black line) with decadal averaged over-lake evaporation (colored horizontal lines).

Figure 12: Annual net basin supply (solid black line) with decadally averaged net basin supply (colored lines) for Lake Ontario
Lake Ice
There are multiple factors that lead to the differing levels of ice cover between the different lakes including depth, surface area, and latitude. Due to the depth of Lake Ontario, it rarely sees widespread ice coverage, as it has a high capacity for heat storage. The small surface area of the lake does not allow for much loss of this stored heat, creating less favorable conditions for ice formation (Figure 13).

Figure 13: Bathymetry (depth) of Lake Ontario.
During the winter months, Lake Ontario experiences varying levels of ice coverage. On average, higher ice coverage is observed closer to the coasts and channels due to more shallow water and protection from winds and currents (Figure 14). Below average ice cover was observed during most years in the past decade for most of the lake surface area. Though there were individual years with high ice cover, such as 2014 and 2019, the overall decadal average was low.

Figure 14: Average ice cover in Lake Ontario from 2010-2019
When considering annual maximum or average ice cover in the Great Lakes, it is common to treat each “ice year” as the period between December (of the previous year) and May (of the current year), as this is when freezing events occur in the region. Figure 15 demonstrates this, with peak ice cover between February and March almost no ice cover in the beginning of December and the middle of May.

Figure 15: Decadal averages of daily ice coverage on Lake Ontario. Data starts in 1973.
There is variability in Lake Ontario ice cover throughout the ice year as well as between different years. Natural modes of climate variability can influence ice coverage. Years with strong El Niño Southern Oscillation (ENSO) events contribute to lower maximum ice coverage, while years with polar vortex intrusions generally lead to higher maximum ice coverage (Figure 16).

Figure 16: Annual maximum ice coverage of Lake Ontario from 1973 to 2021.
Lake Surface Temperature
Surface temperatures of Lake Ontario follow a monthly pattern with the warmest temperatures occurring in late summer and early fall and the coolest temperatures occurring in late winter and early spring(Figure 17).
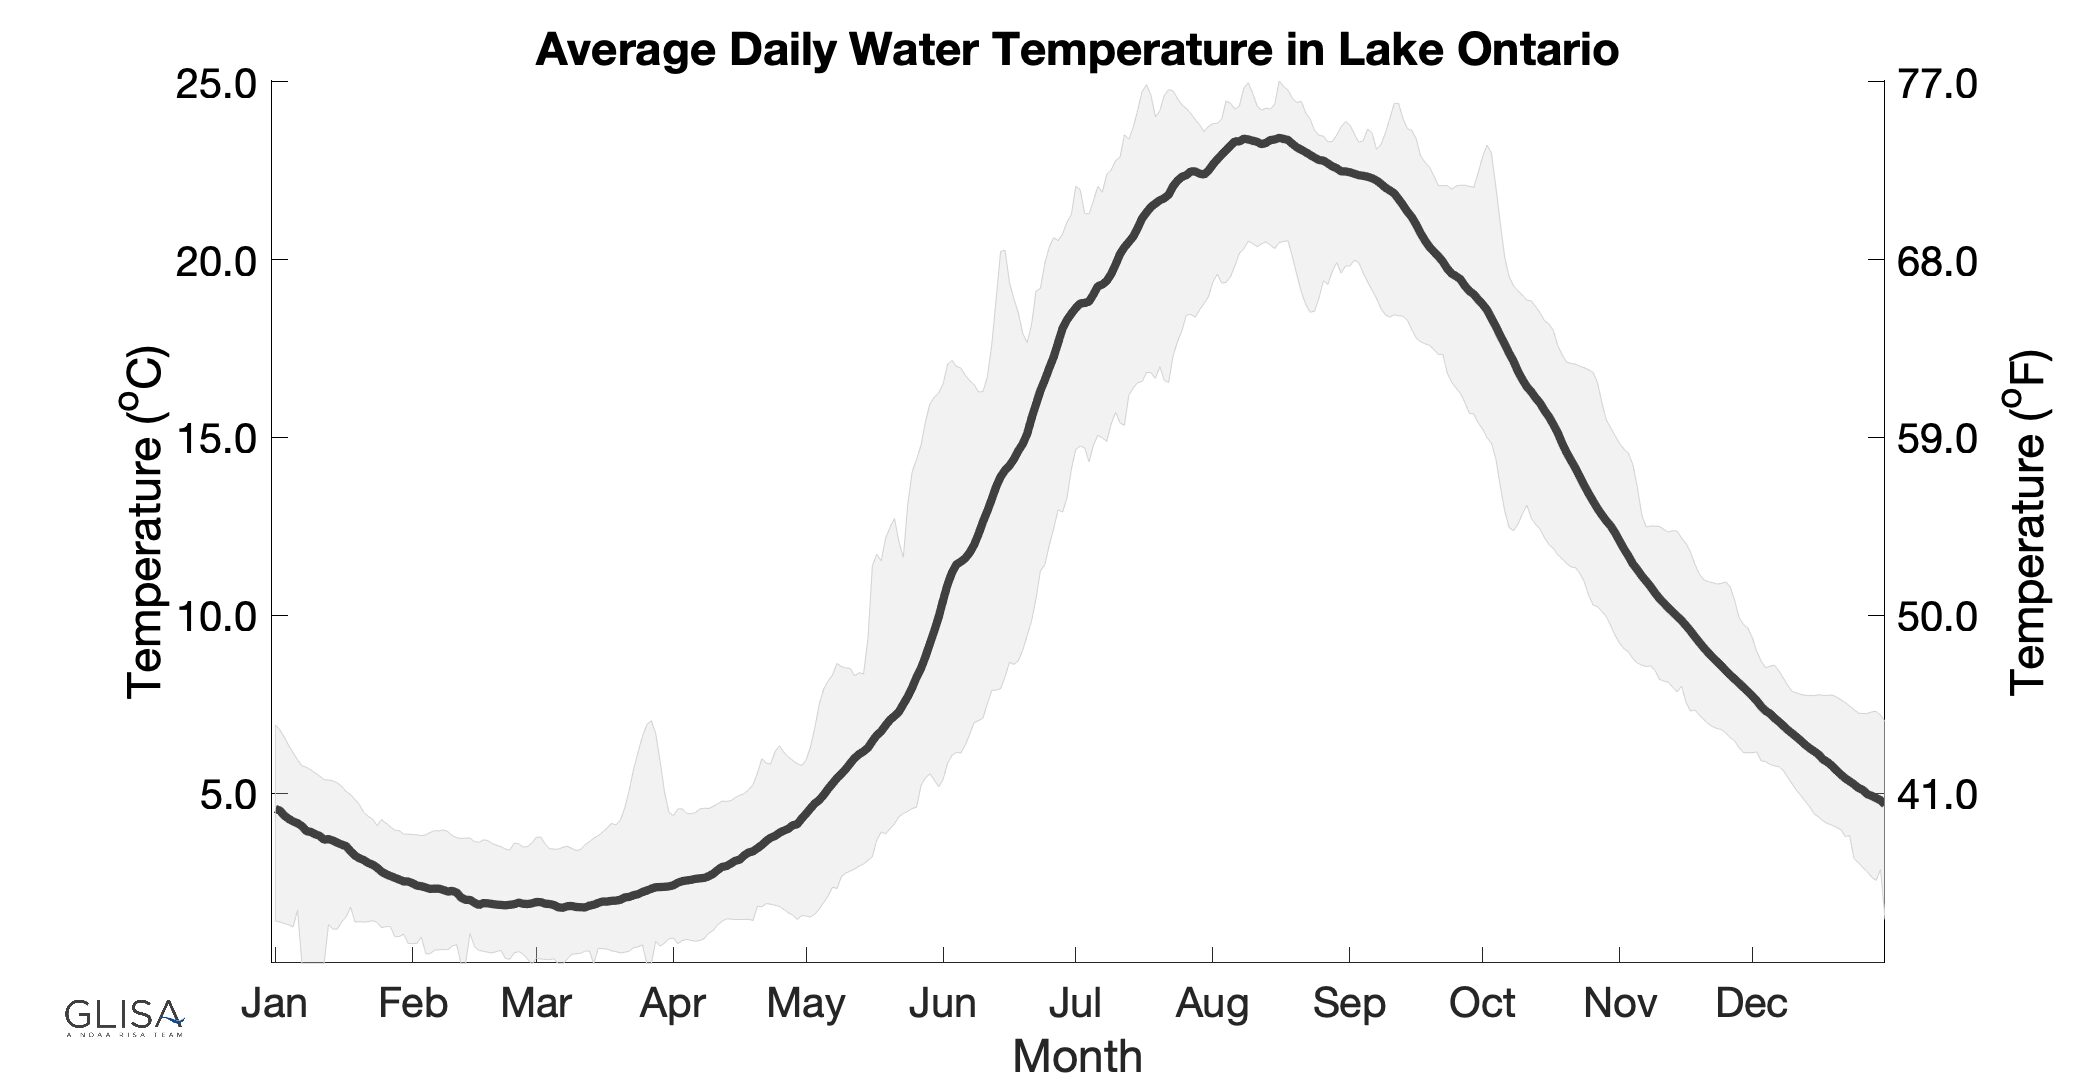
Figure 17: Monthly averaged surface temperature of Lake Ontario from 1995-2020 (black line), with monthly average surface temperatures for individual years (grey lines).
Basin Air Temperature
Despite year to year variability, an overall warming trend in air temperature has been observed in the Lake Ontario basin from 1948 to 2014 (Figure 18).
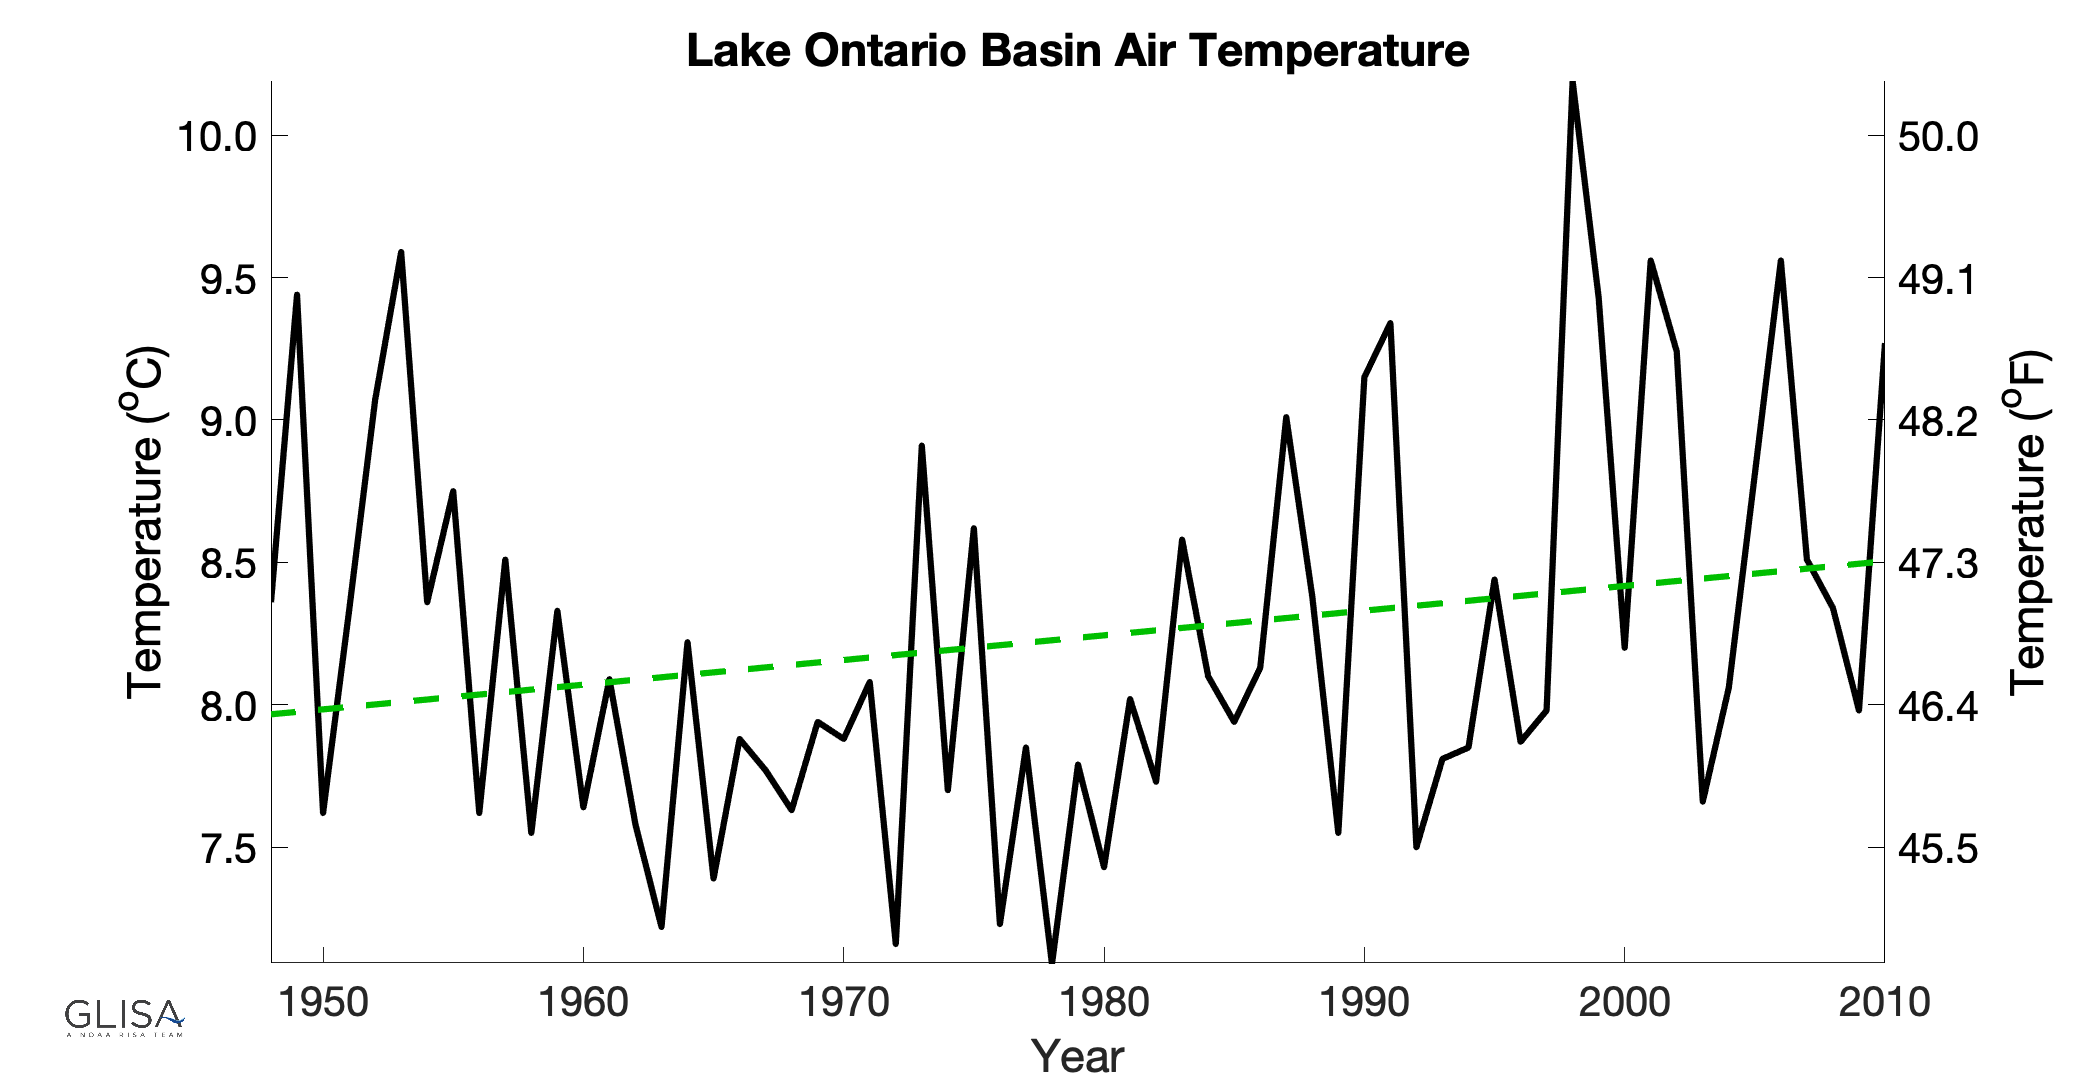
Figure 18: Air temperature in the Lake Ontario basin from 1948-2010 (black line), with a trend line (green dashed line).
Despite an overall warming trend, very warm or very cold years still occur due to annual variability (Figure 19). There are extreme high and low average temperatures throughout the period of record, but recent average temperatures are generally higher than in the past.

Figure 19: Ten year running average (blue line), with annual averages (black circles) of air temperature in the Lake Ontario basin from 1948-2010
If you have questions, comments, or feedback on the Sustained Assessment of the Great Lakes, please contact Kim Channell ([email protected])
This page was published in 2021. It will be updated in 2025 to include more recent data.